Despite the recession and even as the total number of students enrolled in public schools has decline, this is what we learned when we analyzed data on arts courses, enrollment and teachers that was reported by school districts to the California Department of Education (CDE) and posted on DataQuest. Below is a one-page summary our findings. In addition, we’ve compiled the data into Excel tables to download and use. Compare your district to others in LA County. Use the data in writing grants. Tell the story of arts education in your own data visualizations!
This is the first in a series of arts education briefs planned from the LA County Arts Commission. Our next brief will ask whether there is a correlation between arts education offerings and factors like poverty levels or the share of the student body that is English language learners. We also plan to take a closer look at historical trends in arts education by discipline.
As we develop ideas for future arts education briefs, we’d like to hear from you. What would you like us to analyze? Do you have questions about arts education that you’d like us to explore? We invite you to submit your ideas to us.
We’re also interested in tracking how this information is applied so if you use these tables or data, please let us know.
A note on methods
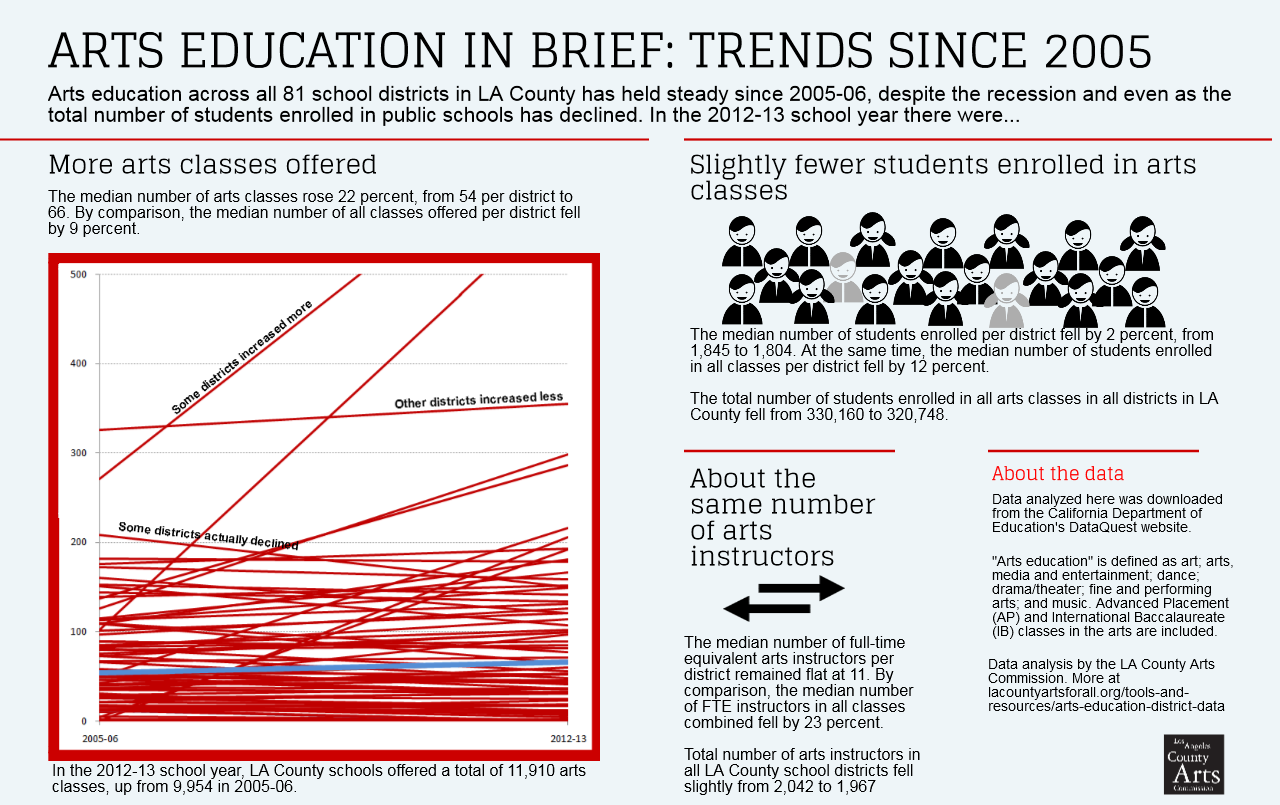
“Arts instruction” was defined here as all courses coded as:
- Art
- Arts, Media and Entertainment
- Dance
- Drama/Theater
- Fine and Performing Arts
- Music
Advanced Placement (AP) and International Baccalaureate (IB) classes in the arts were included. Arts-related courses coded under Physical Education or Career Technical Education were excluded. This data replaces an earlier analysis of CDE data where we used a slightly different definition of “arts education.” These tables and our analysis of them are only as accurate as the data submitted by each district to CDE.
If you have any questions, please contact our Research and Evaluation Associate, Matt Agustin.